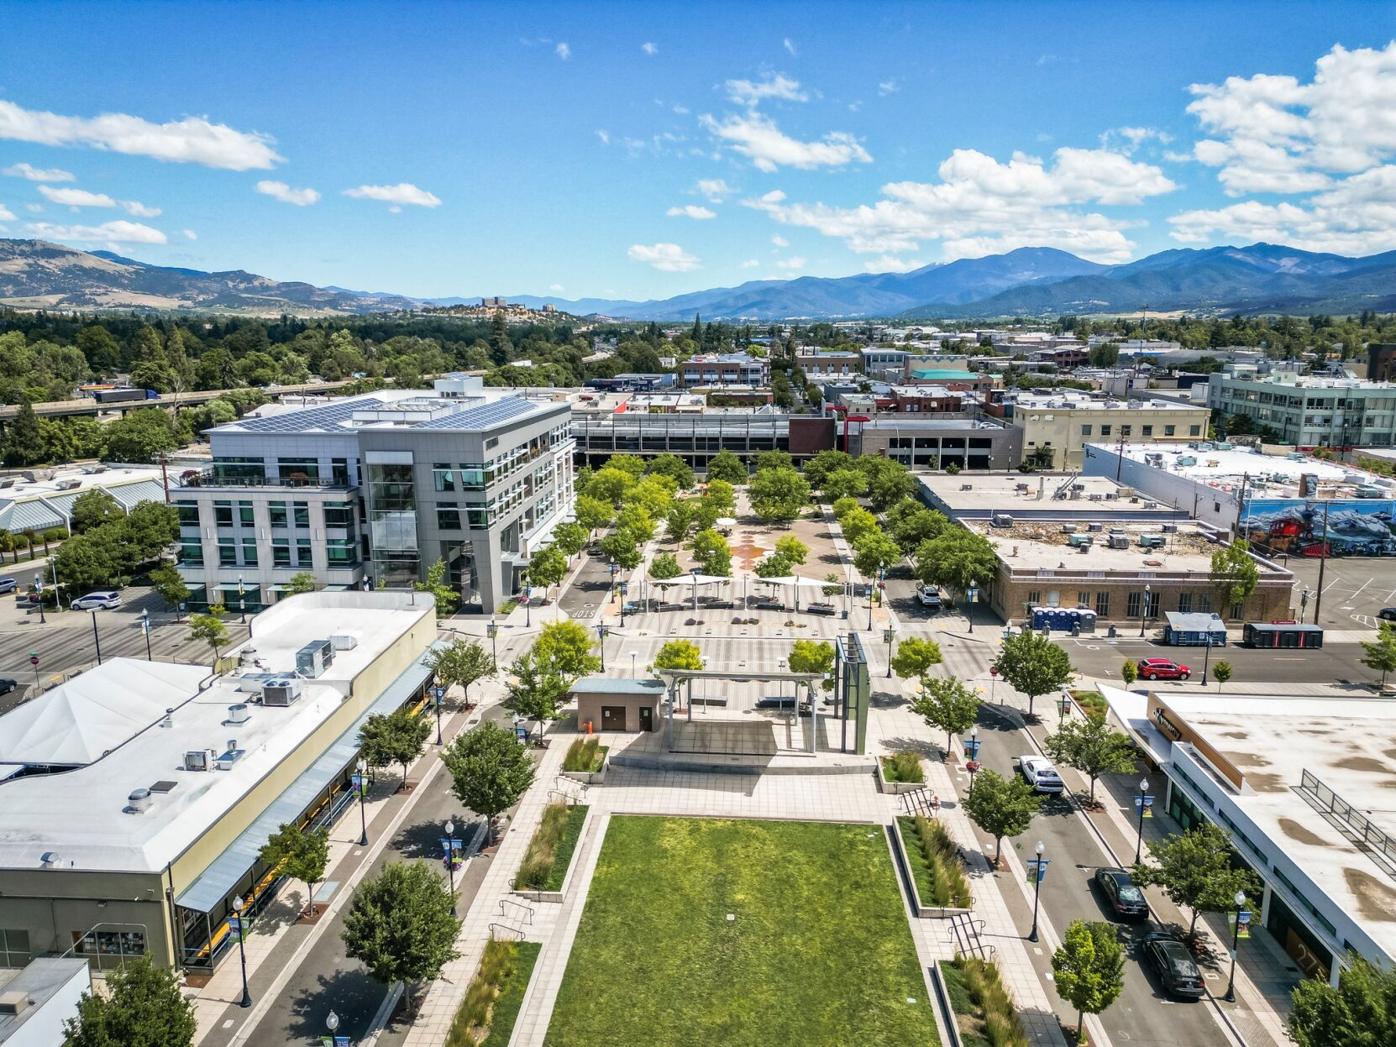
Medford, Oregon
Medford Real Estate and Homes for Sale in Medford, Oregon
Start with the homes, then look closely at the property. I'll help you compare locations, plan showings and work through the questions that matter before you make an offer.
The current listings page shows properties I'm listing or co-listing across Southern Oregon. For homes from other brokerages, use the area-wide search below and select Medford.
Search homes for sale in Medford
Send me the address of a property that interests you. We can arrange an in-person showing or a video tour if you're moving from out of state.
Search all homesMarket right now
Medford real estate market right now
Homes sold
| Year to date | Last 90 days | |
|---|---|---|
| Homes sold | 1,052 | 290 |
| Median sale price | $423,250 | $431,498 |
| Average sale price | $469,788 | $477,682 |
| Median days on market | 28 | 27 |
| Median sale-to-list price | 99.4% | 99.5% |
| Sold over list price | 184 (17.8%) | 55 (19.2%) |
| Sold at list price | 303 (29.3%) | 82 (28.7%) |
| Sold under list price | 548 (52.9%) | 149 (52.1%) |
Sale-to-list price is the closing price divided by the final list price. The over, at and under counts cover 1,035 year-to-date sales and 286 sales in the last 90 days. Year to date means closings from January 1 through November 13, 2026 (the latest closing in the data). Last 90 days means closings from August 19 through November 16, 2026.
Homes for sale now
| Medford area | |
|---|---|
| Active listings | 329 |
| Median list price | $464,900 |
| Median days on market | 79 |
| Months of inventory, at the year-to-date sales pace | 3.3 |
| Months of inventory, at the last-90-days sales pace | 3.4 |
Months of inventory is active listings divided by average monthly closed sales. The year-to-date pace is 100 sales a month and the last-90-days pace is 98. 7 of the 329 active listings have been on the market more than 365 days; without them, months of inventory is 3.2 and 3.3.
Property types
| Sold, year to date | Active now | |
|---|---|---|
| Single-family | 980 (93.2%) | 305 (92.7%) |
| Townhome | 45 (4.3%) | 12 (3.6%) |
| Condo | 21 (2.0%) | 9 (2.7%) |
| Manufactured home | 6 (0.6%) | 3 (0.9%) |
Percentages are rounded.
Scope: Medford-area homes in ZIP codes 97501, 97502, 97503 and 97504 (Jackson County). Single-family, townhome, condo and manufactured homes only; leased-land homes and co-op units are not counted. The data includes homes outside Medford city limits, including some on rural parcels.
Source: Flex MLS - Oregon Data Share, pulled November 2026.
Where and at what price
Medford prices by ZIP code, price range and lot size
All three tables cover homes sold January 1 through November 13, 2026 and homes active now. Months of inventory uses the year-to-date sales pace. Where fewer than 10 homes sold, the table shows the count and a price range instead of a median.
By ZIP code
| ZIP code | Sold, year to date | Share of sales | Sold, last 90 days | Median sale price | Median days on market | Active now | Median list price | Months of inventory |
|---|---|---|---|---|---|---|---|---|
| 97501 | 406 | 38.6% | 103 | $379,000 | 28 | 110 | $387,000 | 2.8 |
| 97504 | 639 | 60.7% | 183 | $472,500 | 28 | 214 | $517,445 | 3.5 |
| 97502 and 97503 combined | 7 | 0.7% | 4 | $305,950 to $760,000 (range) | n/a | 5 | $439,000 to $1,080,000 (range) | n/a |
| Total | 1,052 | 100.0% | 290 | 329 |
By price range
Sold homes are grouped by closing price and active homes by list price. A price exactly on a boundary falls in the higher range.
| Price range | Sold, year to date | Share of sales | Median days on market | Share sold under list price | Active now | Months of inventory |
|---|---|---|---|---|---|---|
| Under $300,000 | 120 | 11.4% | 23 | 59.0% | 40 | 3.5 |
| $300,000 to $399,999 | 308 | 29.3% | 28 | 48.5% | 68 | 2.3 |
| $400,000 to $499,999 | 299 | 28.4% | 30 | 46.3% | 86 | 3.0 |
| $500,000 to $649,999 | 181 | 17.2% | 27 | 58.1% | 65 | 3.8 |
| $650,000 and up | 144 | 13.7% | 28 | 65.2% | 70 | 5.1 |
| Total | 1,052 | 100.0% | 329 |
By lot size
Acreage is the lot size in the MLS record. "0.25 acre or less" includes a lot of exactly 0.25 acre, and each larger range includes its upper edge.
| Lot size | Sold, year to date | Share of sales | Median sale price | Median days on market | Active now | Median list price | Months of inventory |
|---|---|---|---|---|---|---|---|
| 0.25 acre or less | 813 | 77.3% | $410,000 | 28 | 217 | $425,000 | 2.8 |
| Over 0.25 to 0.5 acre | 134 | 12.7% | $475,400 | 26 | 63 | $510,000 | 4.9 |
| Over 0.5 to 1 acre | 36 | 3.4% | $654,475 | 41 | 15 | $699,900 | 4.4 |
| Over 1 to 5 acres | 38 | 3.6% | $659,675 | 40 | 16 | $802,500 | 4.4 |
| Over 5 acres | 22 | 2.1% | $805,000 | 35 | 10 | $1,235,000 | 4.8 |
| No lot acreage listed (all condos and townhomes) | 9 | 0.9% | $160,000 to $290,000 (range) | n/a | 8 | $150,000 to $239,000 (range) | n/a |
| Total | 1,052 | 100.0% | 329 |
Source: Flex MLS - Oregon Data Share, pulled November 2026.
Questions
Five questions about buying in Medford
How much does a home in Medford cost?
The median sale price in the Medford area is $423,250 so far in 2026, and $431,498 over the last 90 days.
Single-family homes are 980 of the 1,052 sales. By ZIP code, the median is $379,000 in 97501 and $472,500 in 97504. Homes for sale now have a median list price of $464,900. Lot size moves the number: homes on 0.25 acre or less sold at a median of $410,000, and homes on over 1 to 5 acres at $659,675.
Is Medford a buyer's market or a seller's market?
It depends on price range: homes from $300,000 to $399,999 have 2.3 months of inventory, and homes at $650,000 and up have 5.1.
Across all 329 active listings, months of inventory is 3.3 at this year's sales pace, and sold homes have a median of 28 days on market. About 53% of sales closed under list price, 29% at list and 18% over. In the $650,000-and-up range, 65% closed under list. In the $300,000-to-$399,999 range, 49% did.
Which rules apply to a Medford home, the city's or the county's?
It depends on whether the parcel is inside Medford city limits, so confirm that before you make an offer.
Parcels inside the city follow the Medford Land Development Code. SFR-4, SFR-6 and SFR-10 zoning appears on 773 of the 1,052 sales. Some sales carry county zoning such as RR-5 or EFU, which Jackson County regulates. In Medford's single-family zones, each primary dwelling may have one accessory dwelling unit, up to 900 square feet or 75% of the primary dwelling, whichever is less (Medford Municipal Code 10.821). Short-term rentals of single-family homes need a City of Medford license.
What should I know about water, sewer, wells and septic in Medford?
Most Medford-area sales list public water and sewer, but some homes have wells, septic systems or irrigation district water, and each adds paperwork or cost.
Of 1,052 sales, 971 list public water and 1,000 list public sewer; 77 list a well, 47 a septic system, 10 Medford Irrigation District and 16 Talent Irrigation District. When a home with a domestic well sells, the seller must test the water for arsenic, nitrate and total coliform bacteria (ORS 448.271). In Jackson County, the state DEQ Medford office permits septic systems.
What should I know about flood, wildfire and insurance in Medford?
Parts of Medford sit in the Bear Creek floodplain, and wildfire risk can affect whether and how you get insurance, so check both for the specific address.
The city regulates building, grading and fill in FEMA-mapped Special Flood Hazard Areas; call the city floodplain manager at 541-774-2380 before you build. Oregon's Legislature repealed the statewide wildfire hazard map in 2025. Insurers may still use their own wildfire risk scores, and Oregon law requires them to explain in writing the property-specific reasons for a wildfire-related cancellation, nonrenewal or premium increase.
Source: Flex MLS - Oregon Data Share, pulled November 2026.
Numbers in these answers come from Sections 1 and 2. Legal and regulatory statements are from the official sources listed in the notes.
Search alert
Get new Medford listings
Talk to Michael